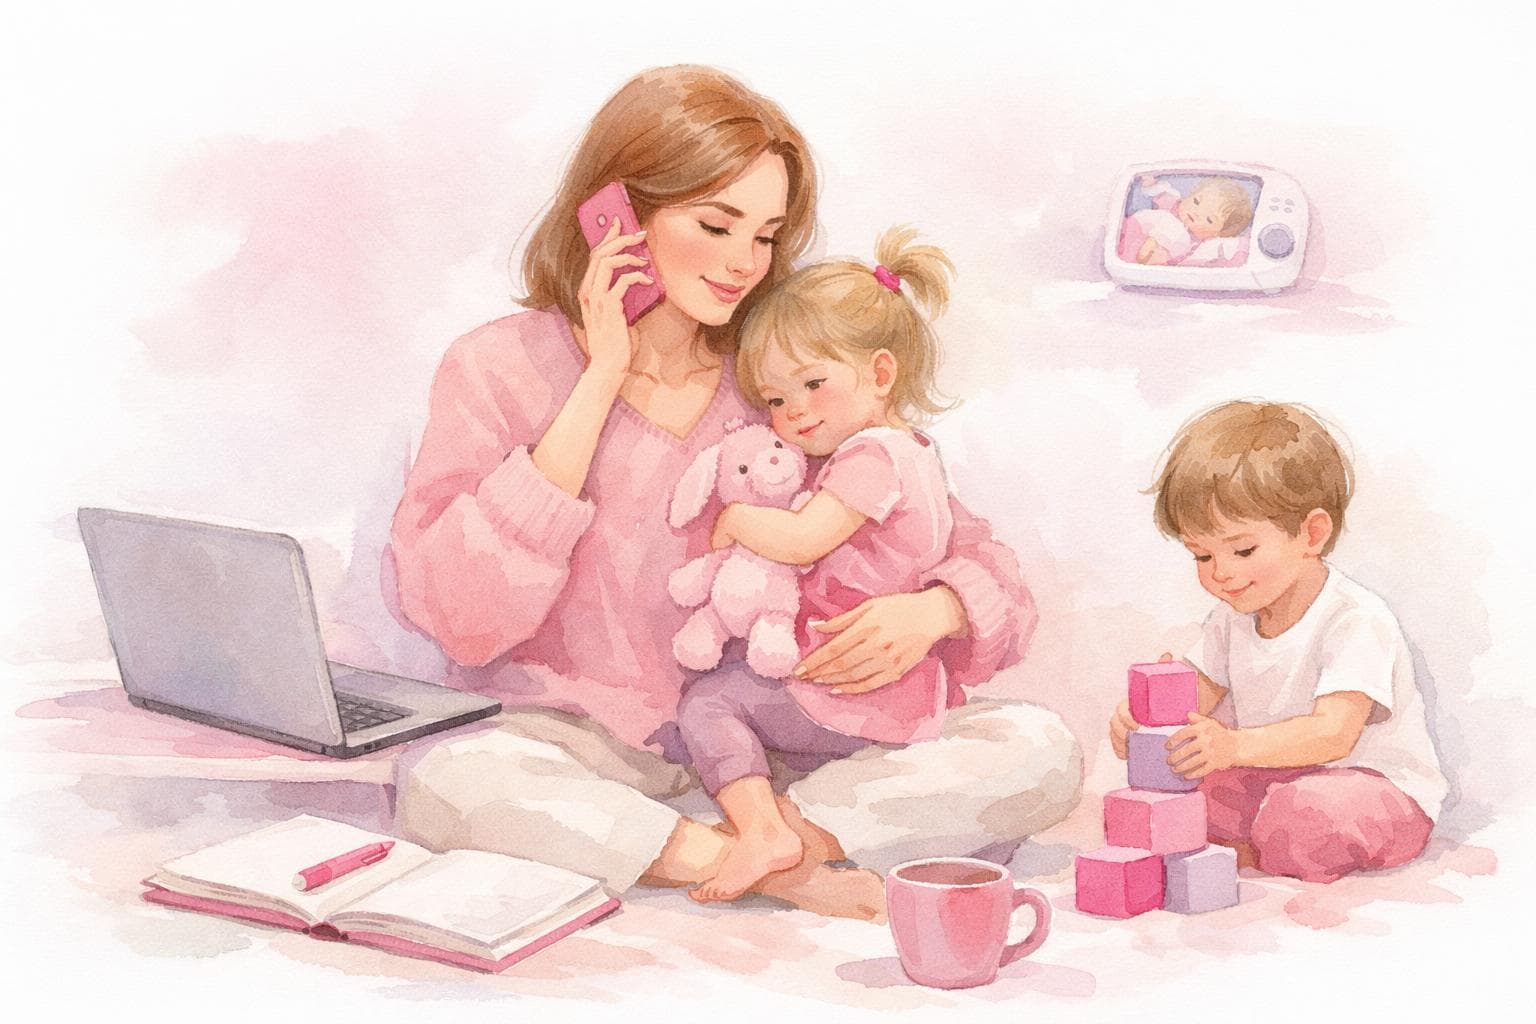
Someone asks what you do, and the honest answer takes longer than the polite one. You are not unemployed. You are not "just" anything. But the word that is supposed to describe your life, stay-at-home mom, carries assumptions from a completely different decade, and the actual data about who fits that label in 2026 looks nothing like the 1950s image most people still picture.
Here is the current, evidence-based picture, not the outdated one.
A stay-at-home mom is a mother, aged 18 to 69 with at least one child under 18 living at home, who was not employed for pay at all in the calendar year prior to being surveyed, according to Pew Research Center's methodology using US Census Bureau data. This definition deliberately includes mothers at home by choice as well as those unable to find work, disabled, or enrolled in school, since Census data cannot always distinguish between these circumstances. As of 2026, Pew Research found that families with a full-time working dad and a stay-at-home mom have dropped to 23%, down from 42% in 1975, while families with both parents working full-time have risen to 52%, making dual-earner households the new statistical majority. This guide walks through what the current data actually shows.
The historical arc, in one table
Year | Share of mothers who are SAHMs | What was driving it |
|---|---|---|
1967 | 49% | Pre-second-wave feminism labour force norms |
1999 | 23%, modern-era low | Peak of women's labour force participation growth |
2012 | 29% | Post-recession economic pressures, rising immigration |
2021 | 26% | Relatively stable, pandemic-era fluctuations beginning |
2025 to 2026 | 23% overall; dual-full-time-working families now 52% of two-parent households | Childcare costs, dual-income necessity, shifting family structures |
The pattern is not linear. It rose, fell, rose again and appears to be declining once more as of the most recent 2026 Pew analysis, which found dual-full-time-earner households have become the statistical majority for the first time in the dataset's history.
Who is actually a SAHM in 2026: the demographic picture
Gitnux's 2026 statistical compilation, drawing on Census, BLS and Pew data, describes a demographic far more varied than the popular image suggests: a median age around 33, with roughly 23% of stay-at-home mothers living in poverty. This is not a uniform group of financially comfortable women who chose to opt out. It spans a wide range of financial circumstances, immigration statuses and reasons for being out of the paid workforce.
Factor | Stay-at-home mothers | Employed mothers |
|---|---|---|
Median age | Younger; more likely under 35 | Older on average |
Educational attainment | Nearly half have a high school diploma or less | 30% have a high school diploma or less |
Poverty rate | 23% to 34%, depending on source and year | 12% |
Reason for not working, 2021 Pew data | 79% cite caregiving for home or family | Not applicable |
Weekly hours of direct childcare | 18 hours | 11 hours |
SAHM vs SAHD: the gender gap is narrowing, slowly
Fathers now represent 18% of stay-at-home parents in the US, up from 11% in 1989, according to Pew Research Center. Between 1989 and 2021, the share of mothers not employed for pay decreased slightly from 28% to 26%, while the share of fathers not working rose from 4% to 7% over the same period. The overall share of parents not employed for pay has remained fairly stable over the past five years, but the composition of who those parents are has shifted meaningfully.
Why the number moved again in 2026
A June 2026 Pew Research study, widely covered including by the Daily Caller, found that childcare costs and broader economic pressures are pushing the two-full-time-earner household to majority status for the first time. Pew's own analysis noted that families where both parents work at least part-time see greater financial benefits than families relying on a single full-time income, a finding directly relevant to any household currently weighing the decision.
Separately, a 2025 survey by Motherly found that roughly 25% of mothers identified as stay-at-home moms that year, up from just 15% in 2022, illustrating how volatile this figure has become in the post-pandemic economy, with childcare costs and time-with-children preferences cited as the two most common reasons.
If you are actively weighing this decision for your own household, our guide to childcare costs and career decisions breaks down the long-term financial calculation behind exactly this trend.
What the label does not capture
The Census-based definition is purely about paid employment status. It says nothing about mental load, income replacement value, or daily lived experience. Our guide to what a stay-at-home mom's labour would actually be worth addresses the economic dimension the Census definition leaves out entirely, and our invisible mental load guide covers the cognitive dimension.
"We find that parents in families where both the mom and the dad work at least part time are more likely to see financial benefits than those in families where the dad works full time and the mom isn't employed." - Pew Research Center (2026)
Where to go if this definition describes you
If the statistics above sound like your household right now, and the mental health dimension of this role is part of what you are navigating, our comprehensive stay-at-home mom hub organises guidance across routines, money, identity and loneliness, the four domains research consistently identifies as central to SAHM wellbeing.
Key takeaways
- Families with a full-time working dad and stay-at-home mom dropped to 23% in 2025 to 2026, down from 42% in 1975, while dual-full-time-working households rose to 52%, a statistical majority for the first time.
- The Census-based definition of SAHM includes any mother not employed for pay in the prior year, regardless of whether she is home by choice, disability, inability to find work, or school enrolment.
- Fathers now represent 18% of stay-at-home parents, up from 11% in 1989, reflecting a slow but real shift in gender composition.
- Between 23% and 34% of stay-at-home mothers live in poverty, depending on the data source and year, compared to roughly 12% of working mothers.
- The percentage has fluctuated significantly since 2022, rising from 15% to roughly 25% by 2025 according to Motherly's survey data, before Pew's 2026 analysis found the broader trend reversing toward dual-income households again.
Sources and further reading
- Pew Research Center. (2026). Families with a stay-at-home parent and a working parent. Cited in Daily Caller. dailycaller.com
- Pew Research Center. (2023, updated data through 2025). Dads make up 18% of stay-at-home parents in the US. pewresearch.org
- Gitnux. (2026). Stay at home mom statistics. gitnux.org
- U.S. Bureau of Labor Statistics. (2014, historical data referenced through 2026 updates). Stay-at-home mothers through the years. Monthly Labor Review. bls.gov
- Sobel, K. (2025). Back to work. Red Hook Star-Revue, citing Motherly survey data. star-revue.com
- Cohn, D., Livingston, G. & Wang, W. (2014). After decades of decline, a rise in stay-at-home mothers. Pew Research Center Social and Demographic Trends.